Drone Weather: Wind at Altitude, METAR, and Kp
Not a generic weather app. RPAS WILCO reads the forecast the way a drone pilot needs it — wind at your flight altitude, drone safety colours, aerodrome METAR, and geomagnetic Kp for GPS reliability.
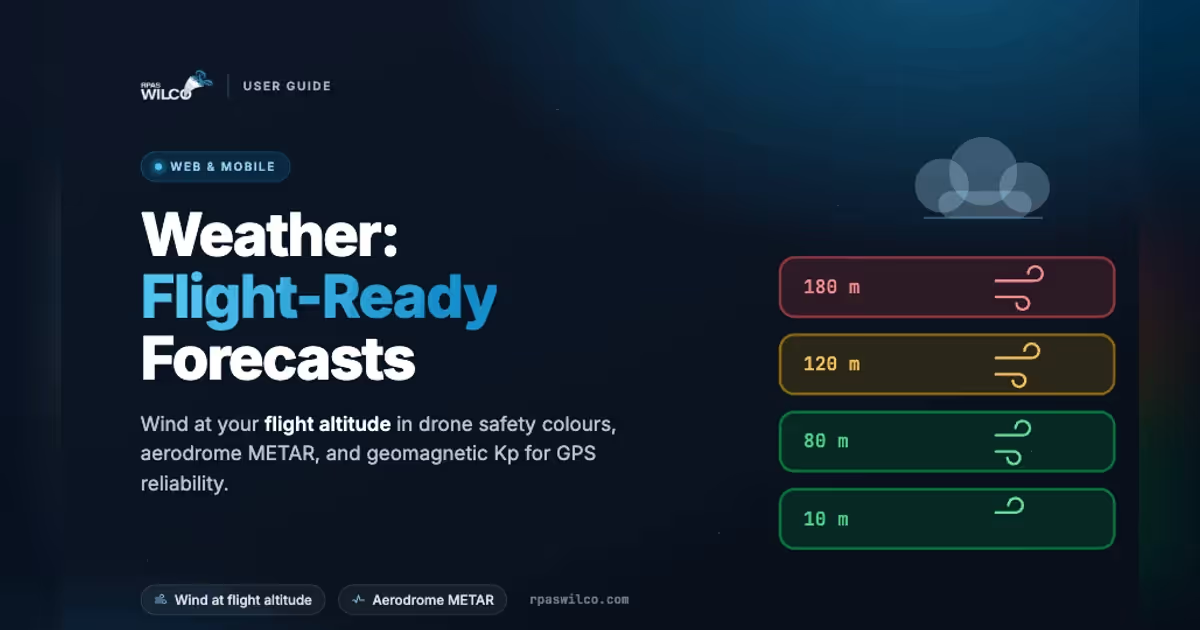
Every weather app tells you what the sky is doing. Almost none of them tell you what a drone pilot actually needs to know: what the wind is doing at 120 m, whether the nearest aerodrome is reporting VFR or IFR, and whether a geomagnetic storm is about to make your compass unreliable.
The RPAS WILCO weather panel is built around those questions instead of around whether you need an umbrella.
Where to find it
Weather is available to any logged-in user — no tier gate.
- Web — open any map page → tap the cloud icon in the map toolbar → the Weather drawer opens on the right
- Mobile — open any Map screen → tap the cloud icon in the toolbar below the menu → full-screen Weather
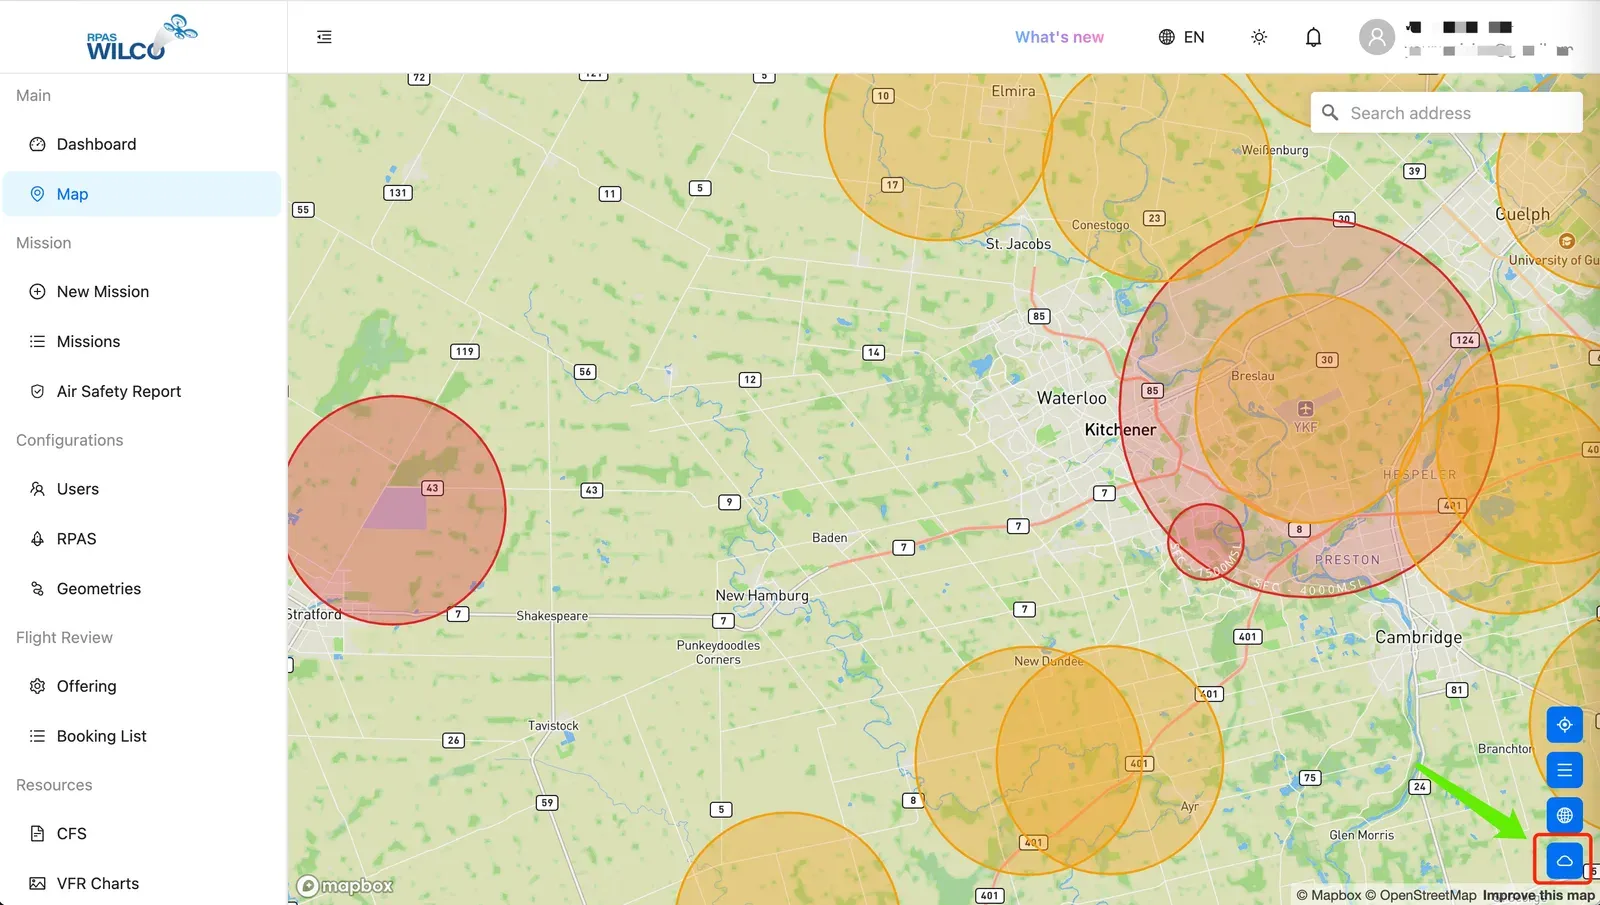
On web. The cloud icon in the map toolbar opens the right-side Weather drawer.
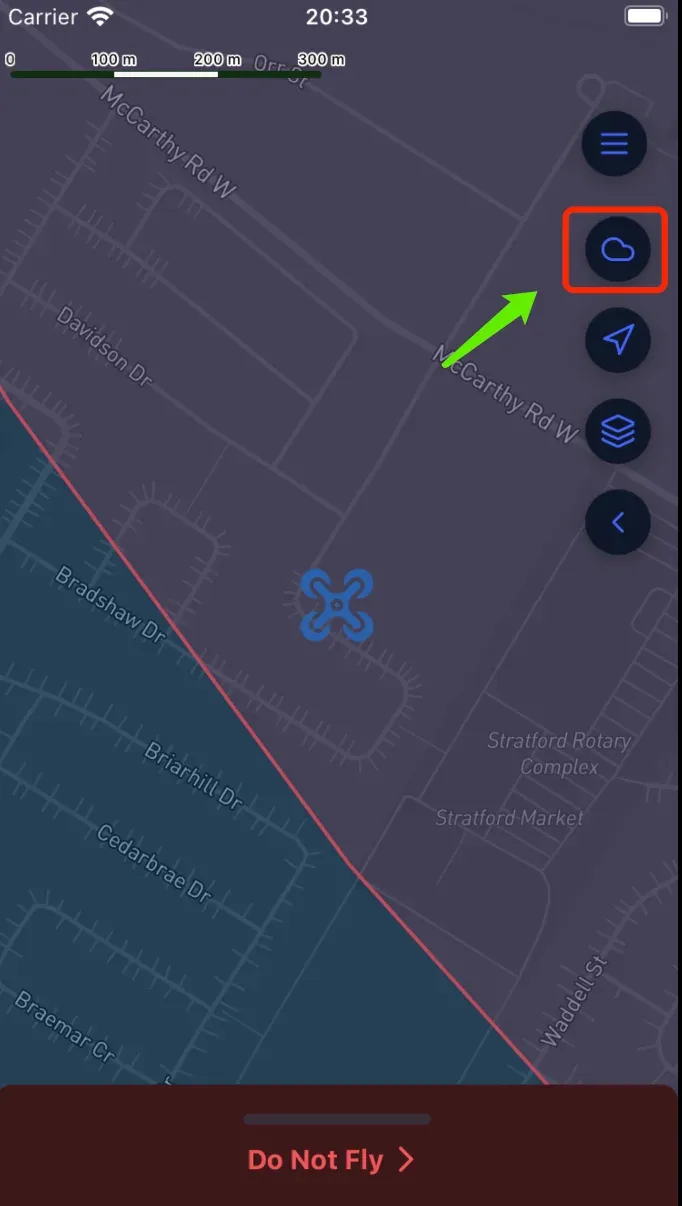
On mobile. The cloud icon on any Map screen opens full-screen Weather.
What location am I looking at?
The forecast is always for wherever the map is centred — no pin to drop, no search box.
- Web — pan with the drawer open and it re-fetches after a brief pause. Micro-pans are ignored.
- Mobile — the map centre at the moment you tap the cloud icon is captured and stays put. For a new spot, go back, re-centre, and tap again.
Most of the panel is location-specific: temperature, wind, cloud cover, precipitation, UV, CAPE, sun times, and the Aviation card. Geomagnetic Kp is the exception — it’s a whole-planet index, the same number wherever the map sits.
If there’s no aerodrome within 30 km, the Aviation card hides itself. You’re too far from a reporting station for METAR to tell you anything actionable about your site.
Three taps to a go / no-go
- Open a map → tap the cloud icon
- Pick a day, then pick an hour
- Read the colour on the Wind card
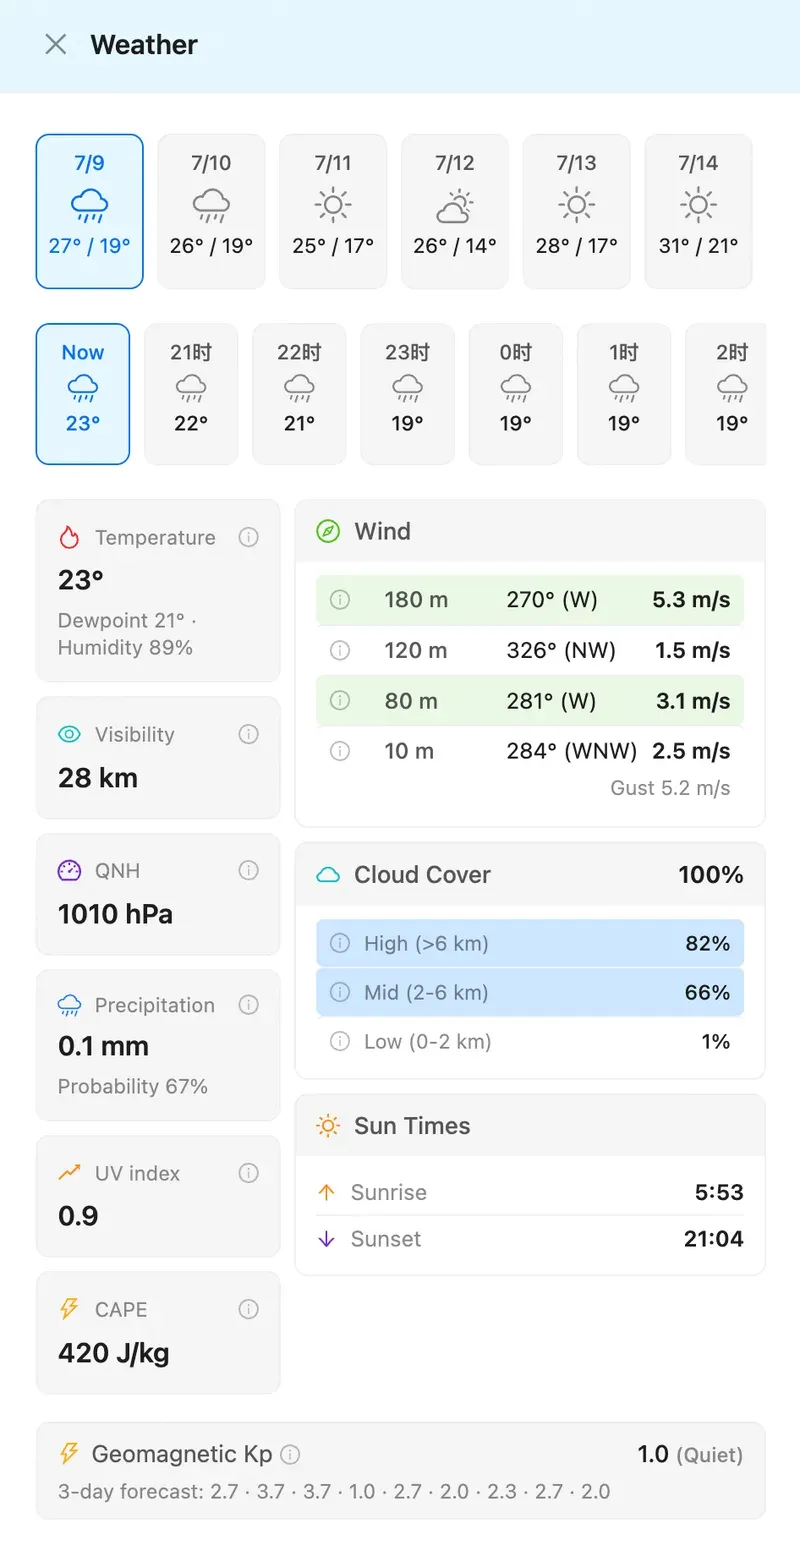
Pick a time. Choose a day, then an hour from the strip.
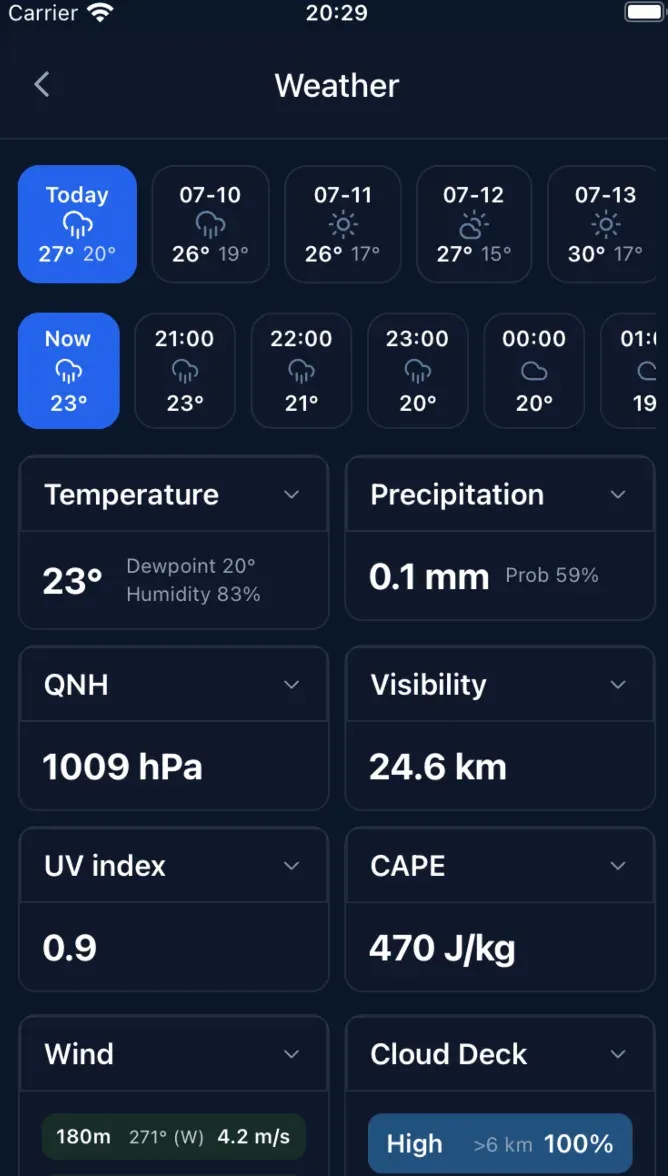
Read the colour. The Wind card tint gives you the call at a glance.
What you see, top to bottom
- Day tabs — 16 days, each with an icon and high / low temperature
- Hour strip — a rolling 24 h on Today (starting at “Now”), 12 AM–11 PM on other days
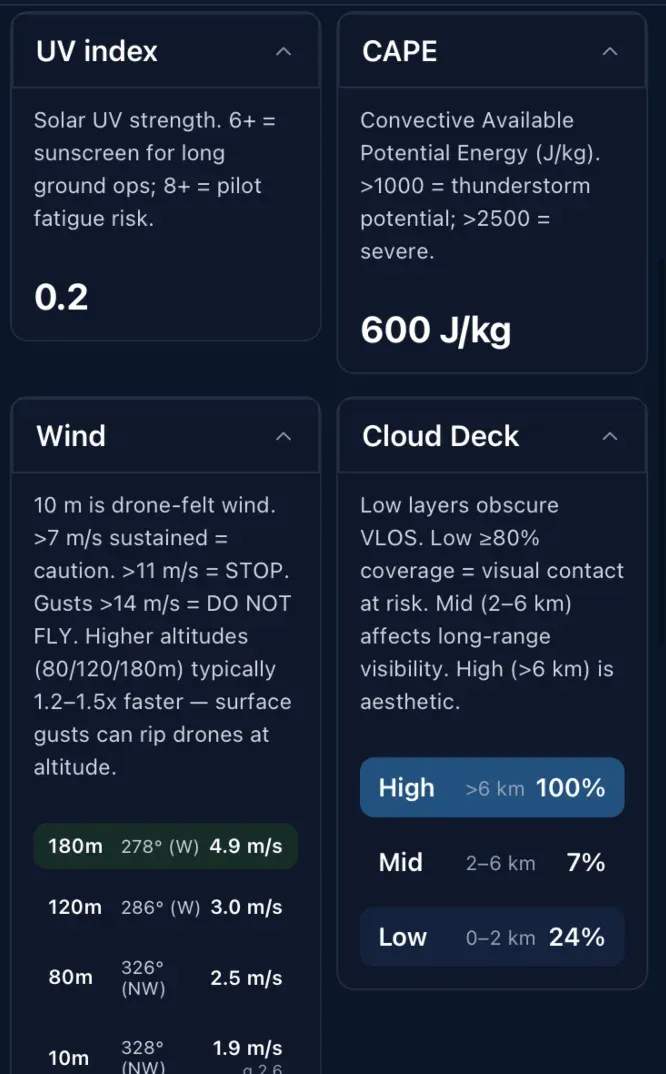
- Detail tiles — Temperature, Visibility, QNH, Precipitation, UV, CAPE
- Wind card — 180 m → 120 m → 80 m → 10 m, colour-tinted for safety
- Cloud Cover — HIGH, MID, LOW, ordered most-to-least visible from the ground
- Sun Times — sunrise and sunset in your local time
- Aviation — nearest aerodrome under 30 km: flight category, METAR, ceiling
- Geomagnetic Kp — now, plus a 3-day forecast for GPS reliability
Read the wind at your flight altitude
This is the card that does the most work. Drones cruise at 80–120 m, where wind behaves very differently from the 10 m figure a consumer forecast quotes. The Wind card is stacked the way the sky is — 180 m at the top, 10 m (ground) at the bottom.
Read the colour, not the number:
- Green — under 7 m/s
- Amber — around 11 m/s, a soft limit
- Red — 14 m/s and above, do not fly
A green reading at ground level sitting under an amber or red band at 120 m is exactly the situation that catches pilots out, and it’s the reason the card shows every layer at once rather than a single headline figure.
Wind matters more in some seasons than others — our guide to winter drone operations covers how cold air and gusts compound the problem.
Know your flight category at a glance
The Aviation card pulls METAR from the nearest aerodrome and derives the standard VFR / MVFR / IFR / LIFR flight category as a colour-coded badge. No raw METAR string to decode.
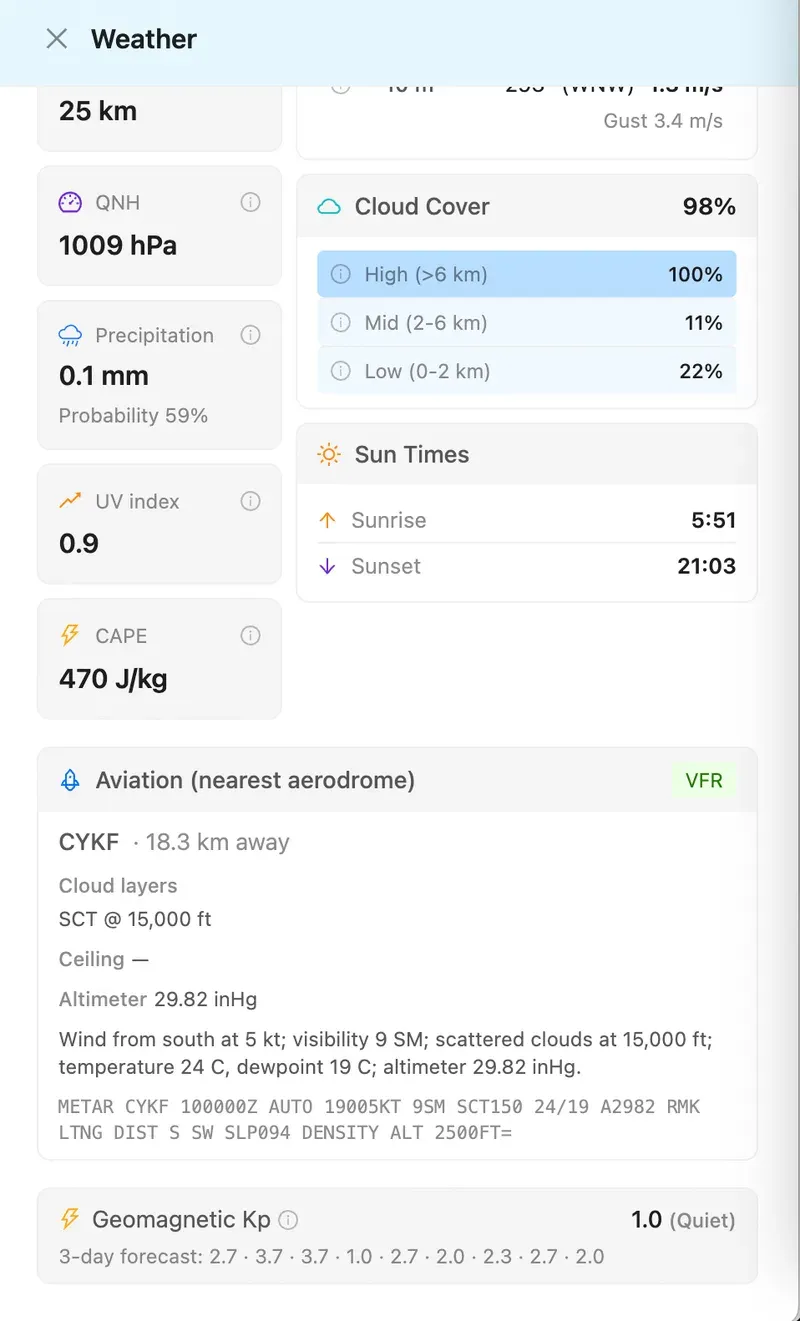
Flight category. A colour-coded badge for the current picture.
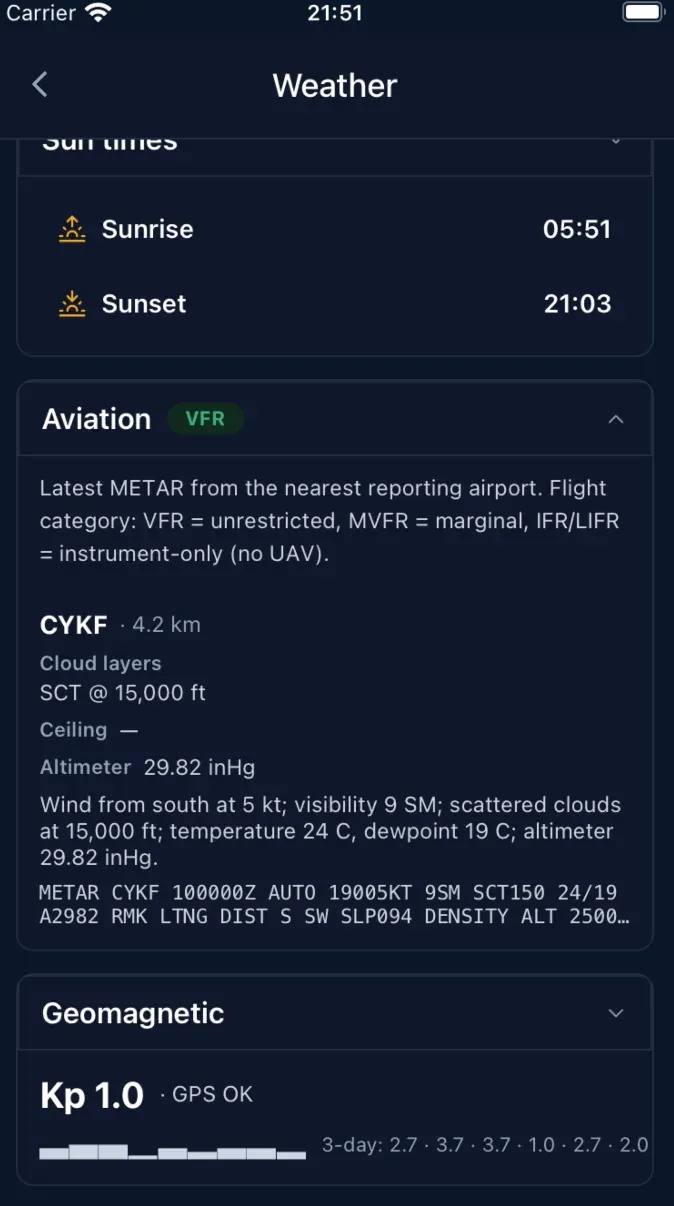
Nearest aerodrome. METAR and ceiling, decoded for you.
If you’re flying anywhere near that aerodrome’s airspace, the flight category is only half the picture — check the active restrictions too. Our guide to decoding NOTAMs explains how to read them, and the free airspace map shows where the boundaries sit.
Check GPS reliability before you go
Geomagnetic storms drift a drone’s compass. The Kp card shows the current index plus a 3-day forecast at 8-hour cadence, so you can plan around a disturbed period days ahead rather than discovering it on site:
- 0–3 — quiet, GPS OK
- 4 — unsettled
- 5+ — storm, do not fly
This is the one card that isn’t tied to your map location. Kp is a planetary index — the same value everywhere.
Thunderstorm forecasting without the false alarms
CAPE tells you whether the atmosphere could storm; the weather code tells you what’s actually expected. The panel reads them together, and the lightning icon stays hidden unless low or mid cloud reaches 80 % or more — high cirrus alone won’t trigger it.
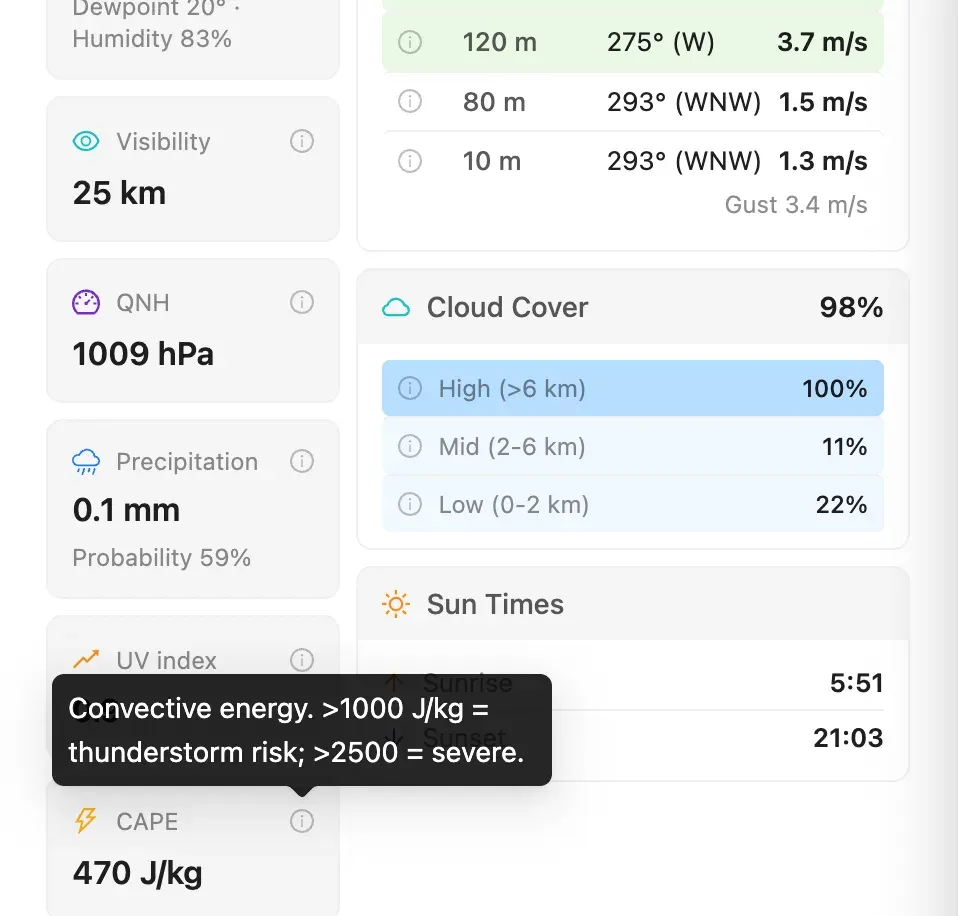
CAPE + code. Potential and expectation, read together.
No false alarm. Lightning shows only when the deck can deliver.
Why the rain icon fires so eagerly
The rain indicator triggers on any precipitation category, down to light drizzle at 0.5 mm/hour. That looks over-cautious until you consider it from the airframe’s perspective rather than yours:
- Water builds up on the rotors — enough to unbalance thrust over a mission
- Most airframes aren’t sealed. One flight through drizzle can short an ESC or gimbal, and it voids the warranty
- The gimbal lens fogs, ruining the footage the sortie exists to capture
- Near 0 °C it ices the props. That isn’t reduced performance, that’s a fall
So read the panel in three passes: the icon is a safety signal aimed at your drone, not your umbrella. The Precipitation tile gives millimetres plus probability, so you can weigh how much risk is actually on the table. And Cloud Cover · LOW is a physics cross-check — thin low cloud often means the drop evaporates mid-air as virga and never reaches you.
“No rain outside” and “safe to fly” are not the same call. The icon is calibrated for the drone.
On mobile
Same content, different frame: mobile is a full-screen route, web is a side drawer. Every card, colour, and unit is identical. Tap the cloud icon on any Map screen — that’s it.
Frequently asked questions
Why m/s instead of km/h? It’s the SI unit, and it matches the ICAO and MET conventions used in aerodrome briefings — no conversion needed when you’re comparing against Transport Canada thresholds.
How fresh is the forecast? Cache TTL is one day, and a background job refreshes actively-queried grids on a rolling window, so frequently-checked locations stay minutes-fresh.
Can I look further than 16 days out? Not today — 16 days is the Open-Meteo forecast window we consume.
Do I need a paid plan? No. Weather is available to any logged-in user, with no tier gate.
The bottom line
A go / no-go call for a drone isn’t the same call as a go / no-go for a picnic. Wind at 120 m, the aerodrome’s flight category, and the planetary Kp index are the three numbers that decide most flights — and all three sit in one panel, two taps from any map.
Pair it with a saved mission geometry for the site and a completed pre-flight checklist, and the whole go / no-go decision takes about a minute.
For the full click-by-click walkthrough on both platforms, see the Weather guides in the Help Centre.